Difference Between R square and Adjusted R square
In many of the supervised machine learning problem statement basically we have two kind of use cases.
1.Regression
2.classification
For Regression type use case if we want to check accuracy usually we follow the techniques like R square and adjusted R square.
In this article we will be discuss about difference between R square and adjusted R square.
1. R square
R square formula is given by,

 | = | coefficient of determination |
 | = | sum of square of residuals or error |
 | = | total sum of square |
Here residuals are sum of square of difference between actual point and predict point. and for given data if we have only target variable we will find the best fit line by taking average of all the values. so total sum of square of actual points and average value.
So from above formula we will get value between 0 and 1, the more value near to 1 is the best fit line.
whether can we get R2 value less than 0?
YES, only when your best fit line is worse than average best fit line.
If RSS > TSS so ratio become >1 so R2 will be negative value, thus model will be bad (best fit line worse.)
R2 is basically used to check the goodness of the best fit line.
if we have y = mx + c - - - - - simple linear regression
y = m1x1 + m2x2 + c - - - - - multiple linear regression
so as we go on adding independent features to our model, R2 value usually increases. because when we are adding new features in linear regression it tries to apply some coefficient value to those features.
for example: m3x3 - - - m3 is new coefficient such that our RSS value goes on decreasing as a result R2 score will be increase due to formula.
thus, adding new independent features to the model R2 value will also increases but here this new independent features may not be corelated with target variable that basically indicates that R2 have not doing anything with independent feature i,e it is not finding any relationship with the target variable, just depends on co-efficient assigned by linear regression.
to overcome from this type of difficulty we follow with Adjusted R square method.
2. Adjusted R square
The formula is: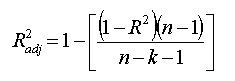
where:
- N is the number of points in your data sample.
- K is the number of independent regressors, i.e. the number of variables in your model, excluding the constant.
Good blog it gives so much information about stats
ReplyDelete